My guide to grafana / influxdb: Difference between revisions
| (47 intermediate revisions by the same user not shown) | |||
| Line 8: | Line 8: | ||
influx | influx | ||
</pre> | </pre> | ||
you can also surf to http://db-01.edgarbv.int:8083/ to check if it works | ''you can also surf to http://db-01.edgarbv.int:8083/ to check if it works'' '''Depreciated after 1.1''' | ||
Back in the cli (influx) enter | Back in the cli (influx) enter | ||
< | <pre> | ||
Visit https://enterprise.influxdata.com to register for updates, InfluxDB server management, and monitoring. | Visit https://enterprise.influxdata.com to register for updates, InfluxDB server management, and monitoring. | ||
Connected to http://localhost:8086 version 1.0.2 | Connected to http://localhost:8086 version 1.0.2 | ||
| Line 19: | Line 19: | ||
</pre> | </pre> | ||
==Filling influxdb using evologger== | [https://docs.influxdata.com/influxdb/v1.7/query_language/functions/ InfluxQL functions] | ||
To see the time as human readable When you first connect to the CLI, specify the rfc3339 precision: | |||
$ influx -precision rfc3339 | |||
==Filling influxdb using evologger For Honeywell Evohome== | |||
[https://evohome-client.readthedocs.io/en/latest/index.html Evohome client readme] | [https://evohome-client.readthedocs.io/en/latest/index.html Evohome client readme] | ||
[https://github.com/watchforstock/evohome-client Evohome client github] | [https://github.com/watchforstock/evohome-client Evohome client github] | ||
| Line 29: | Line 35: | ||
cd /opt/ | cd /opt/ | ||
git clone https://github.com/freeranger/evologger.git | git clone https://github.com/freeranger/evologger.git | ||
git clone https://github.com/watchforstock/evohome-client.git | |||
pip install ./evohome-client | pip install ./evohome-client | ||
pip install influxdb | pip install influxdb | ||
| Line 41: | Line 47: | ||
<pre> | <pre> | ||
use honeywell | use honeywell | ||
show measurements | > show measurements | ||
name: measurements | |||
------------------ | |||
name | |||
zone_temp.actual | |||
zone_temp.delta | |||
zone_temp.target | |||
select * from "zone_temp.actual" | select * from "zone_temp.actual" | ||
</pre> | </pre> | ||
should give you some results. | should give you some results. | ||
NB this method takes all the data at the time of polling from the honeywell API instead of incrementally adding to it as Domoticz does. | |||
To get it running under a system username | |||
adduser --system evologger | |||
addgroup evologger | |||
touch /var/log/evologger | |||
chown evologger:evologger /var/log/evologger | |||
chgrp evologger /opt/evologger/ -R | |||
chmod 664 /opt/evologger/temps.csv | |||
To get it to run as a service | |||
vi /opt/evologger/evologger.sh | |||
<pre> | |||
#!/bin/bash | |||
pushd /opt/evologger | |||
./evologger.py $>>/var/log/evologger | |||
</pre> | |||
chmod 754 /opt/evologger/evologger.sh | |||
To start it up as a service | |||
vi /usr/lib/systemd/system/evologger.service | |||
<pre> | |||
[Unit] | |||
Description=Evologger instance | |||
Documentation=https://wiki.edgarbv.com/index.php?title=My_guide_to_grafana_/_influxdb | |||
Wants=network-online.target | |||
After=network-online.target | |||
After=grafana.service grafana-server.service mariadb.service mysql.service | |||
[Service] | |||
User=evologger | |||
Group=evologger | |||
Restart=on-failure | |||
ExecStart=/opt/evologger/evologger.sh &>>/var/log/evologger | |||
[Install] | |||
WantedBy=default.target | |||
</pre> | |||
systemctl enable evologger | |||
systemctl start evologger | |||
vi /etc/logrotate.d/evologger | |||
<pre> | |||
/var/log/evologger { | |||
daily | |||
missingok | |||
rotate 7 | |||
compress | |||
delaycompress | |||
notifempty | |||
} | |||
</pre> | |||
Note - if the graph in grafana is a flat line, this is probably because the evohome system has lost connection to the internet. In the influx cli you will see entries for when evologger is running, but evologger will get and pass the last known values from mytotalconnectcomfort.com, so the database ''is'' filling | |||
==Filling influxdb using domoticz== | |||
===For Honeywell Evohome=== | |||
Under Setup -> More Options -> InfluxDB | |||
Under Edit Link select the Device Name, value (Status / Temperature / Set Point), target type ('''direct''': it sends everything it knows periodically / '''On value change''': only when the value changes it will be sent) | |||
'''Note for target type:''' for Set Point and Status you will need to set direct, to populate the database with the first data points. Once influxdb has been populated, you can change it to on value change) and click Add. It will appear in the table above. | |||
Under general settings fill in database name and port 8086 :) | |||
'''Under database in the format''': honeywell-domoticz&u=USERNAME&p=PASSWORD | |||
Also fill in username and password | |||
Turn on Debug to test if data is being sent. You can find the log in Setup -> log. It will show entries like | |||
InfluxLink: value Temperature,idx=1,name=Huisje:-Living-room value=21.0 | |||
Save. | |||
Now let it run for a (long) while. Then you can use the influx cli to | |||
<pre> | |||
> show measurements | |||
name: measurements | |||
------------------ | |||
name | |||
Set-point | |||
Status | |||
Temperature | |||
>select * from "Set-point" | |||
</pre> | |||
=Grafana= | =Grafana= | ||
==Installation== | |||
[https://grafana.com/grafana/download?platform=linux The Grafana download page] | [https://grafana.com/grafana/download?platform=linux The Grafana download page] | ||
[https://grafana.com/docs/installation/debian/ debian installation page for grafana] | [https://grafana.com/docs/installation/debian/ debian installation page for grafana] | ||
[https://grafana.com/docs/installation/configuration/ Configuration page for grafana] | |||
<pre> | <pre> | ||
apt-get install libfontconfig1 apt-transport-https | apt-get install libfontconfig1 apt-transport-https | ||
| Line 78: | Line 184: | ||
;allow_sign_up = false | ;allow_sign_up = false | ||
</pre> | </pre> | ||
And add the key | |||
curl https://packages.grafana.com/gpg.key | sudo apt-key add - | |||
Now you can add a data source, which is an influxdb, with name set to Honeywell, URL set to http://db-01.edgarbv.int:8086/ and Influxdb database name, user and password filled in. You can then save and test. | Now you can add a data source, which is an influxdb, with name set to Honeywell, URL set to http://db-01.edgarbv.int:8086/ and Influxdb database name, user and password filled in. You can then save and test. | ||
NOTE the URL for data access is port 8086! | NOTE the URL for data access is port 8086! | ||
==Dashboards== | |||
[https://grafana.com/docs/guides/getting_started/ Getting started with Grafana guide] | [https://grafana.com/docs/guides/getting_started/ Getting started with Grafana guide] | ||
If you want to mass search and replace something you can copy the whole JSON model to an editor, change it and paste it back in the Dashboard Settings | |||
[https://play.grafana.org https://play.grafana.org] has loads of example dashboards to explore and copy | |||
To rename your dashboard, in the settings under General you can change the name | |||
==Variables== | |||
[https://grafana.com/docs/reference/templating/ templating / Variables guide Grafana] | |||
* variables can't be re-used over dashboards | |||
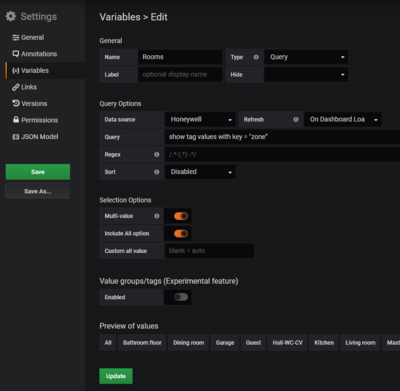
To simplify your life you can get the keys from influxdb and use them as variables. You can then use them for repeating graphs or to put all the variables into a single graph. In order to do that in the dashboard settings you can create a new variable. Set the name to Room, type to Query. Choose the datasource and put in the query. For the honeywell evo Freeranger logger the query is | |||
show tag values with key = "zone" | |||
which will give you all the rooms / zones. | |||
Under selection options, you turn on multi-value and include all option. | |||
[[File:grafana_edit_variables.png|400px]] | |||
To use the variables, when you create a new panel, don't choose to add a visualisation, but choose to Add Query. | |||
===Template=== | |||
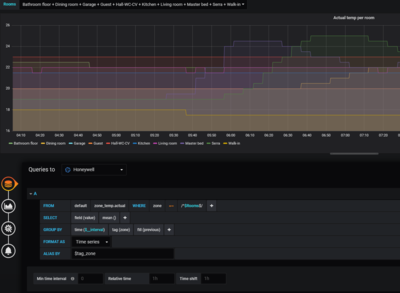
To show all the zones in a single graph (templated) | |||
You can now choose the Rooms variable in the FROM statement | |||
FROM default zone_temp.actual WHERE zone =~ /^$Rooms$/ | |||
SELECT field(value) last() | |||
GROUP BY time($__interval) tag(zone) fill(previous) | |||
FORMAT AS Time Series | |||
ALIAS BY $tag_zone | |||
To get the labels right you need | |||
GROUP BY tag(zone) | |||
ALIAS BY $tag_zone | |||
[[File:grafana_query_all_zones_in_one_graph_for_actual_temperature.png|400px]] | |||
By clicking next to the rooms, you can then select which rooms you want to see. | |||
[https://play.grafana.org/d/000000002/influxdb-templated?orgId=1&from=now%2Fd&to=now Template example with influxdb] | |||
===Repeated panels=== | |||
When adding / editing repeated panels there are a few gotcha's | |||
* after an edit, save the dashboard and reload it (open a different one and go back) to see the changes | |||
* if you can't see any repeats, check the variable up top (eg Rooms) and make sure more than one is selected, or all is selected | |||
* if you select 'save current variables' during the save, you will also save your layout and time selection | |||
* only edit the first panel to propagate through to the rest of the panels | |||
So create your variable (see above) | |||
For a graph of the honeywell influxdb stuff the Query is: | |||
FROM default zone_temp.actual WHERE zone =~ /^$Rooms$/ | |||
SELECT field(value) last() | |||
GROUP BY time($__interval) tag(zone) fill(previous) | |||
FORMAT AS Time series | |||
ALIAS BY $tag_zone | |||
Oddly enough you can't use $tag_zone as a variable for the Title in General. For this you need | |||
Title $Rooms Actual temp | |||
Under repeating | |||
Repeat Rooms | |||
Direction Horizontal | |||
Max per row 2 | |||
[[File:grafana_template.png|400px]] | |||
To get the 2 day average temp for all rooms | |||
Query: | |||
FROM default zone_temp.actual WHERE zone =~ /^$Rooms$/ | |||
SELECT field(value) mean() | |||
GROUP BY time($__interval) tag(zone) fill(previous) | |||
Visualisation Singlestat: | |||
Stat Average | |||
Thresholds 21,24 | |||
Colors blue/green/red | |||
Spark lines show | |||
Gauge show | |||
Gauge show threshold markers | |||
General: | |||
Title $Rooms 2d Average | |||
Repeat Rooms | |||
Direction Horizontal | |||
Max per row 24 | |||
[[File:grafana_template_2d_average_singlestat.png|400px]] | |||
The current temp gauges query: | |||
FROM default zone_temp.actual WHERE zone =~ /^$Rooms$/ | |||
SELECT field(value) mean() | |||
GROUP BY time($__interval) tag(zone) fill(previous) | |||
Visualisation Gauge: | |||
Show Last | |||
Unit Celcius (oC) | |||
Gauge min value 0 / max 50 / show marker | |||
Thresholds red 23 | |||
General: | |||
Title Current temp $Rooms | |||
Repeat Rooms | |||
Direction Horizontal | |||
Max per row 24 | |||
[[File:grafana_template_current_temp_gauge.png|400px]] | |||
==Query considerations== | |||
[https://grafana.com/docs/features/datasources/influxdb/ Grafana and Influxdb] | |||
(Honeywell Evohome) Because you are using Temperatures and you don't want an average temp but the real temp shown, in the SELECT part of the query, change from mean() to last() (which is under selectors). | |||
Because our time is not regular updates, we keep GROUP_BY at time($__interval) | |||
In order to fill up where lines don't meet, in GROUP BY fill(previous). If you don't do this with a gauge and you are using a fixed time interval | |||
If you want to change the name of the line in the legend, fill in ALIAS BY with the label you want to use | |||
To show a specified time range on the dashboard (eg you are looking for a page with graphs that immediately shows the last day, week and month) you fill in all the way below the queries the '''Relative Time''' box with 1d, 7d, 4w, etc. | |||
==Evohome logger dashboard== | |||
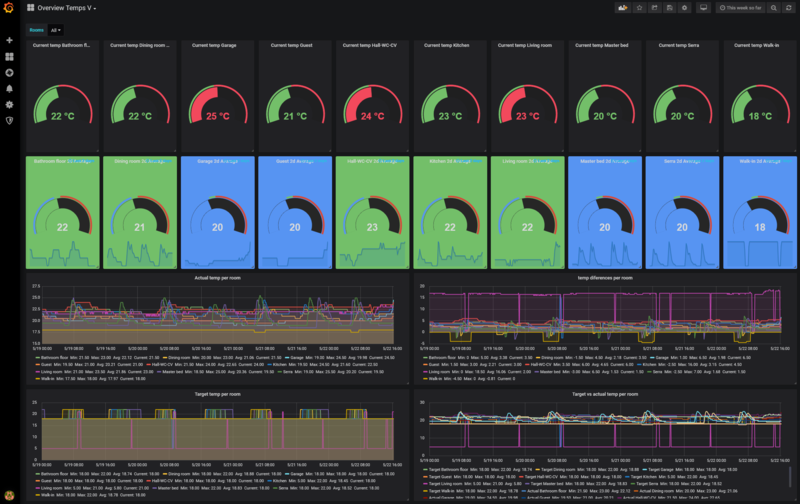
An overview page | |||
[[File:evohome overview page.png|800px]] | |||
[[:File:honeywell evohome overview JSON.txt]] | |||
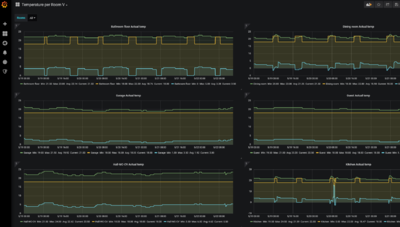
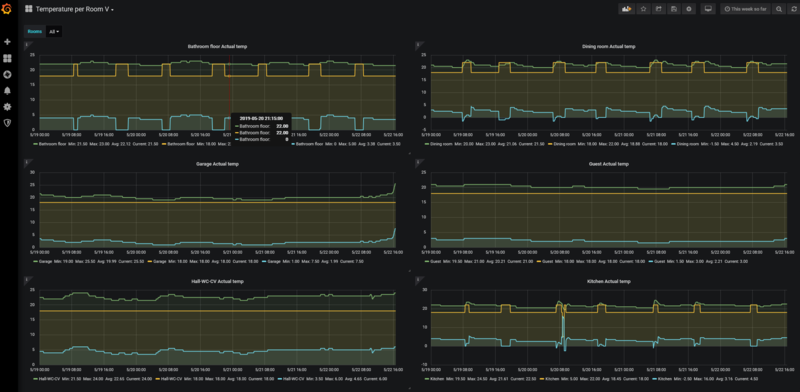
Temperature per room template page | |||
[[File:grafana_honeywell_temperature_per_room.png|800px]] | |||
[[:File:honeywell evohome temp per room JSON.txt]] | |||
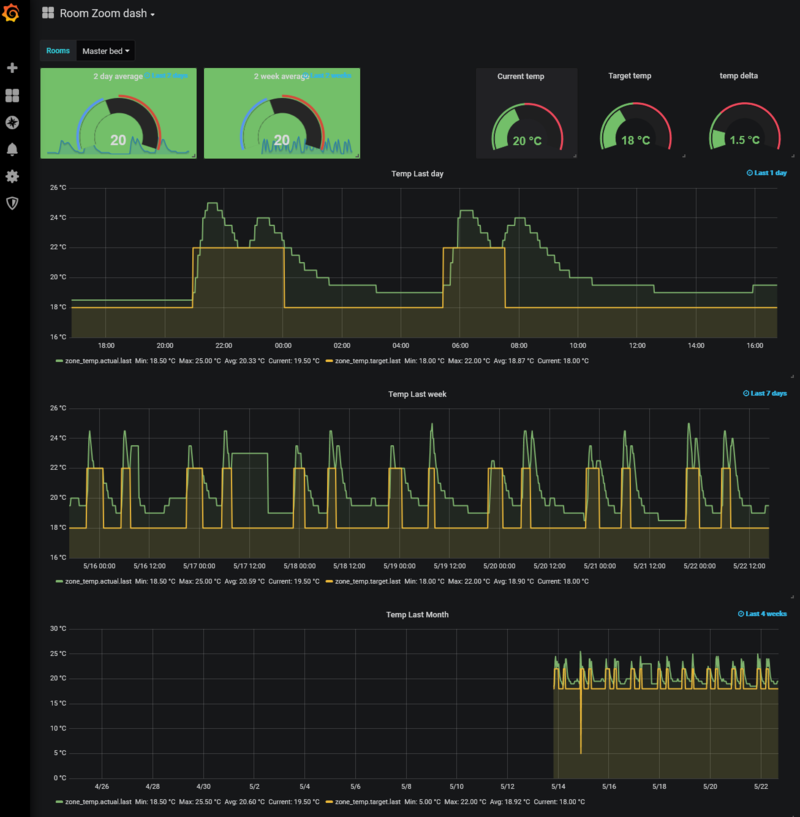
Single room page | |||
[[File:grafana_honeywell_room_details.png|800px]] | |||
[[:File:honeywell evohome single room JSON.txt]] | |||
Latest revision as of 13:48, 16 December 2020
adapted from SmartThings Data Visualisation using InfluxDB and Grafana
Influxdb
apt-get install influxdb influxdb-cli influxdb-client
service influxdb start
systemctl enable influxdb
influx
you can also surf to http://db-01.edgarbv.int:8083/ to check if it works Depreciated after 1.1
Back in the cli (influx) enter
Visit https://enterprise.influxdata.com to register for updates, InfluxDB server management, and monitoring.
Connected to http://localhost:8086 version 1.0.2
InfluxDB shell version: 1.0.2
> create database "honeywell"
> create user "grafana" with password 'password'
To see the time as human readable When you first connect to the CLI, specify the rfc3339 precision:
$ influx -precision rfc3339
Filling influxdb using evologger For Honeywell Evohome
Evohome client readme Evohome client github Freeranger evologger
apt install git
apt-get install python-pip
cd /opt/
git clone https://github.com/freeranger/evologger.git
git clone https://github.com/watchforstock/evohome-client.git
pip install ./evohome-client
pip install influxdb
now cd /evologger
vi config.ini and fill in the usernames and influxdb stuff (port 8806)
To check if the data is being entered, use the influx cli
use honeywell
> show measurements

name: measurements
------------------
name
zone_temp.actual
zone_temp.delta
zone_temp.target

select * from "zone_temp.actual"
should give you some results.
NB this method takes all the data at the time of polling from the honeywell API instead of incrementally adding to it as Domoticz does.
To get it running under a system username
  adduser --system evologger
  addgroup evologger
  touch /var/log/evologger
  chown evologger:evologger /var/log/evologger
  chgrp evologger /opt/evologger/ -R
  chmod 664 /opt/evologger/temps.csv
To get it to run as a service
vi /opt/evologger/evologger.sh
#!/bin/bash

pushd /opt/evologger
./evologger.py $>>/var/log/evologger
chmod 754 /opt/evologger/evologger.sh
To start it up as a service
vi /usr/lib/systemd/system/evologger.service
[Unit]
Description=Evologger instance
Documentation=https://wiki.edgarbv.com/index.php?title=My_guide_to_grafana_/_influxdb
Wants=network-online.target
After=network-online.target
After=grafana.service grafana-server.service  mariadb.service mysql.service

[Service]
User=evologger
Group=evologger
Restart=on-failure
ExecStart=/opt/evologger/evologger.sh &>>/var/log/evologger

[Install]
WantedBy=default.target
  systemctl enable evologger
  systemctl start evologger
vi /etc/logrotate.d/evologger
/var/log/evologger {
        daily
        missingok
        rotate 7
        compress
        delaycompress
        notifempty
}
Note - if the graph in grafana is a flat line, this is probably because the evohome system has lost connection to the internet. In the influx cli you will see entries for when evologger is running, but evologger will get and pass the last known values from mytotalconnectcomfort.com, so the database is filling
Filling influxdb using domoticz
For Honeywell Evohome
Under Setup -> More Options -> InfluxDB
Under Edit Link select the Device Name, value (Status / Temperature / Set Point), target type (direct: it sends everything it knows periodically / On value change: only when the value changes it will be sent)
Note for target type: for Set Point and Status you will need to set direct, to populate the database with the first data points. Once influxdb has been populated, you can change it to on value change) and click Add. It will appear in the table above.
Under general settings fill in database name and port 8086 :)
Under database in the format: honeywell-domoticz&u=USERNAME&p=PASSWORD
Also fill in username and password
Turn on Debug to test if data is being sent. You can find the log in Setup -> log. It will show entries like
InfluxLink: value Temperature,idx=1,name=Huisje:-Living-room value=21.0
Save.
Now let it run for a (long) while. Then you can use the influx cli to
> show measurements
name: measurements
------------------
name
Set-point
Status
Temperature

>select * from "Set-point"
Grafana
Installation
The Grafana download page debian installation page for grafana Configuration page for grafana
apt-get install libfontconfig1 apt-transport-https
vi /etc/apt/sources.list
deb https://packages.grafana.com/oss/deb stable main
now you can install
dselect update
apt-get install grafana
systemctl daemon-reload
systemctl enable grafana-server
mv /var/lib/grafana/ /home/
ln -s /home/grafana /var/lib/grafana
systemctl start grafana-server
Verify it works by visiting
http://monitor.edgarbv.int:3000
admin / admin
change password
vi /etc/grafana/grafana.ini
;allow_sign_up = false
And add the key
curl https://packages.grafana.com/gpg.key | sudo apt-key add -
Now you can add a data source, which is an influxdb, with name set to Honeywell, URL set to http://db-01.edgarbv.int:8086/ and Influxdb database name, user and password filled in. You can then save and test.
NOTE the URL for data access is port 8086!
Dashboards
Getting started with Grafana guide
If you want to mass search and replace something you can copy the whole JSON model to an editor, change it and paste it back in the Dashboard Settings
https://play.grafana.org has loads of example dashboards to explore and copy
To rename your dashboard, in the settings under General you can change the name
Variables
templating / Variables guide Grafana
- variables can't be re-used over dashboards
To simplify your life you can get the keys from influxdb and use them as variables. You can then use them for repeating graphs or to put all the variables into a single graph. In order to do that in the dashboard settings you can create a new variable. Set the name to Room, type to Query. Choose the datasource and put in the query. For the honeywell evo Freeranger logger the query is
show tag values with key = "zone"
which will give you all the rooms / zones. Under selection options, you turn on multi-value and include all option.
To use the variables, when you create a new panel, don't choose to add a visualisation, but choose to Add Query.
Template
To show all the zones in a single graph (templated)
You can now choose the Rooms variable in the FROM statement
  FROM default zone_temp.actual WHERE zone =~ /^$Rooms$/
  SELECT field(value) last()
  GROUP BY time($__interval) tag(zone) fill(previous)
  FORMAT AS Time Series
  ALIAS BY $tag_zone
To get the labels right you need
  GROUP BY tag(zone)
  ALIAS BY $tag_zone
By clicking next to the rooms, you can then select which rooms you want to see.
Template example with influxdb
Repeated panels
When adding / editing repeated panels there are a few gotcha's
- after an edit, save the dashboard and reload it (open a different one and go back) to see the changes
- if you can't see any repeats, check the variable up top (eg Rooms) and make sure more than one is selected, or all is selected
- if you select 'save current variables' during the save, you will also save your layout and time selection
- only edit the first panel to propagate through to the rest of the panels
So create your variable (see above) For a graph of the honeywell influxdb stuff the Query is:
  FROM default zone_temp.actual WHERE zone =~ /^$Rooms$/
  SELECT field(value) last()
  GROUP BY time($__interval) tag(zone) fill(previous)
  FORMAT AS Time series
  ALIAS BY $tag_zone
Oddly enough you can't use $tag_zone as a variable for the Title in General. For this you need
Title $Rooms Actual temp
Under repeating
  Repeat Rooms
  Direction Horizontal
  Max per row 2
To get the 2 day average temp for all rooms Query:
  FROM default zone_temp.actual WHERE zone =~ /^$Rooms$/
  SELECT field(value) mean()
  GROUP BY time($__interval) tag(zone) fill(previous)
Visualisation Singlestat:
  Stat Average
  Thresholds 21,24
  Colors blue/green/red
  Spark lines show
  Gauge show
  Gauge show threshold markers
General:
  Title $Rooms 2d Average
  Repeat Rooms
  Direction Horizontal
  Max per row 24
The current temp gauges query:
  FROM default zone_temp.actual WHERE zone =~ /^$Rooms$/
  SELECT field(value) mean()
  GROUP BY time($__interval) tag(zone) fill(previous)
Visualisation Gauge:
  Show Last
  Unit Celcius (oC)
  Gauge min value 0 / max 50 / show marker
  Thresholds red 23
General:
  Title Current temp $Rooms
  Repeat Rooms
  Direction Horizontal
  Max per row 24
Query considerations
(Honeywell Evohome) Because you are using Temperatures and you don't want an average temp but the real temp shown, in the SELECT part of the query, change from mean() to last() (which is under selectors).
Because our time is not regular updates, we keep GROUP_BY at time($__interval)
In order to fill up where lines don't meet, in GROUP BY fill(previous). If you don't do this with a gauge and you are using a fixed time interval
If you want to change the name of the line in the legend, fill in ALIAS BY with the label you want to use
To show a specified time range on the dashboard (eg you are looking for a page with graphs that immediately shows the last day, week and month) you fill in all the way below the queries the Relative Time box with 1d, 7d, 4w, etc.
Evohome logger dashboard
An overview page
File:honeywell evohome overview JSON.txt
Temperature per room template page
File:honeywell evohome temp per room JSON.txt
Single room page
